
In today’s digital landscape, data analytics has emerged as the backbone of strategic decision-making, transforming how organizations extract value from their ever-expanding information assets. Yet as data volumes surge to unprecedented levels, traditional approaches and tools for data analytics are increasingly revealing their limitations.
Conventional data analysis methodologies typically involve significant manual intervention, data transformation, and jumping between dashboards creating bottlenecks that compromise both efficiency and accuracy when confronted with massive datasets. AI tools for data analytics are the game-changers redefining what’s possible in the data intelligence space. By harnessing sophisticated technologies like natural language processing, in-place querying, and real-time analytics, these innovative solutions can uncover subtle correlations and insights that would remain hidden to human analysts, all while enabling real-time analysis and decision support.
McKinsey research demonstrates that organizations embracing data-driven strategies consistently outperform market averages, with profit increases ranging from 15-20%. Data intelligence platforms like Lumenn AI, Power BI, and Tableau underscores the importance of integrating AI to enhance insight discovery, improve user experience, and deliver more intuitive answers to complex business questions.
With the analytics marketplace becoming increasingly crowded, selecting the right AI tool that aligns with your specific organizational requirements can be challenging. Our article lists the top 7 AI tools for data analytics in with their key features and functionalities, helping you make an informed decision that drives your business forward.
Top 7 AI-Powered Data Analytics Tools to Explore in 2025
Lumenn AI
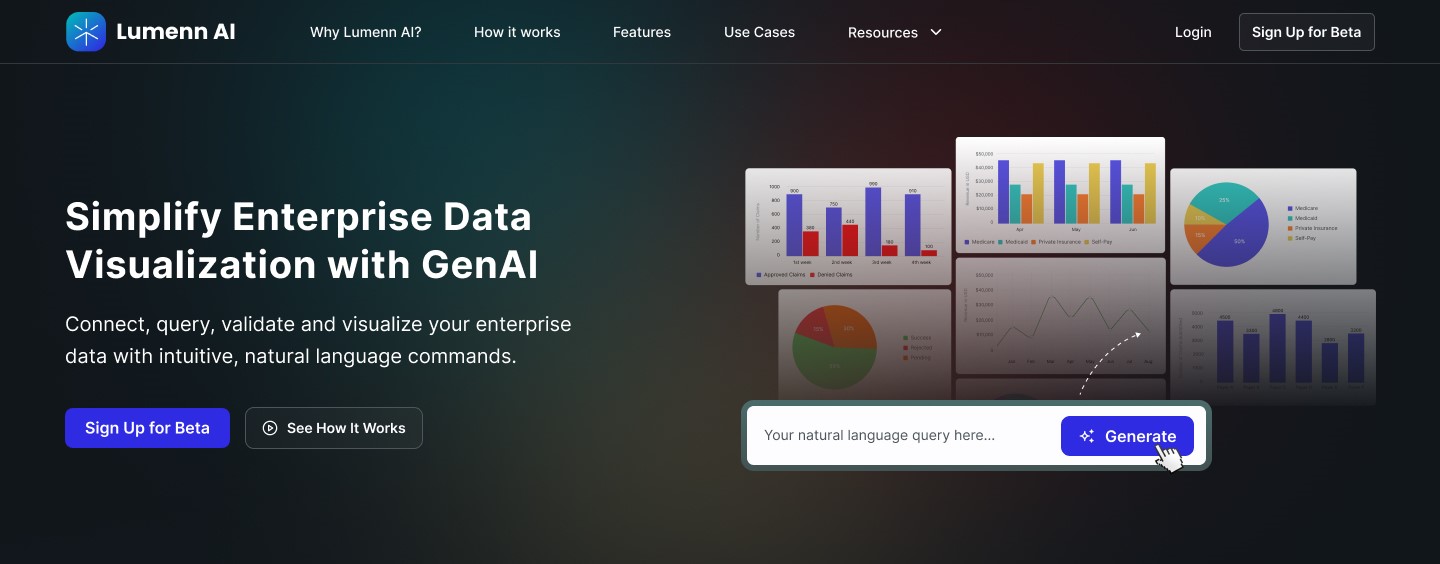
Lumenn AI stands as a pioneering intelligence platform revolutionizing how organizations leverage data for strategic decision-making. This no-code, NLP-powered BI and data analytics solution empowers users to interact with data through simple English prompts, delivering instantaneous insights via reports and data visualizations. From no-code employees seeking instant BI reports to business stakeholders preparing dynamically updating BI dashboards to share with the team, Lumenn AI enables every team member to unlock the full potential of their enterprise data irrespective of their coding or technical knowledge.
Featuring NLP (Natural Language Processing) capabilities for genuine self-service of data alongside integration with multiple data sources of varying data format, Lumenn AI makes data analysis fast and secure eliminating any need for risky data migration or duplication. In-place querying by Lumenn AI ensures maximum data security while democratizing access to enterprise data without the need of ETL building by a data engineer or BI analyst making AI your BI team.
Power BI
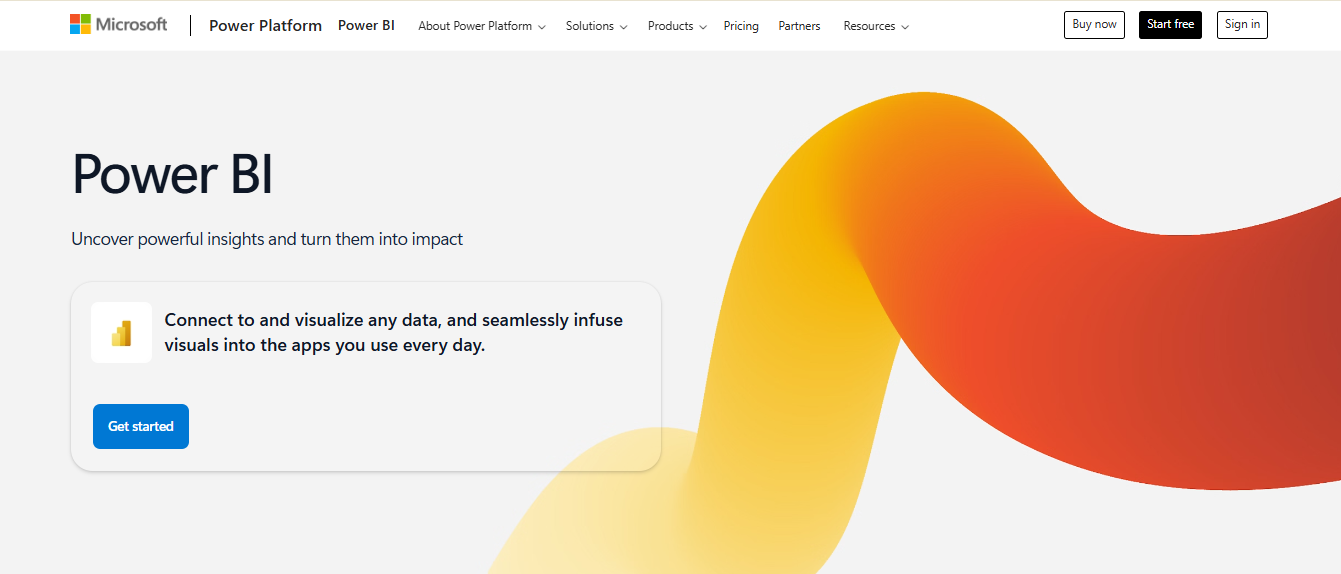
Power BI is a powerful analytics tool integrated with Microsoft’s ecosystem, enabling businesses to analyze and visualize large datasets. While its interface is intuitive, unlocking its full potential requires some training, especially for business users.
Power BI’s core features include Data Visualization and Reporting, which transforms data into easy-to-understand charts and graphs. It seamlessly Connects with the Microsoft Ecosystem, integrating with tools like Excel, Azure, and SQL Server for streamlined data access. Additionally, Power BI offers robust Data Modeling to organize and structure data from multiple sources, and Data Transformation tools to clean and prepare data for analysis.
The platform also supports Sharing and Collaboration, allowing users to share and work together on reports and dashboards. This enhances teamwork and decision-making by ensuring everyone has access to the same insights. Overall, Power BI helps businesses turn data into actionable insights, driving strategic growth and innovation.
Tableau
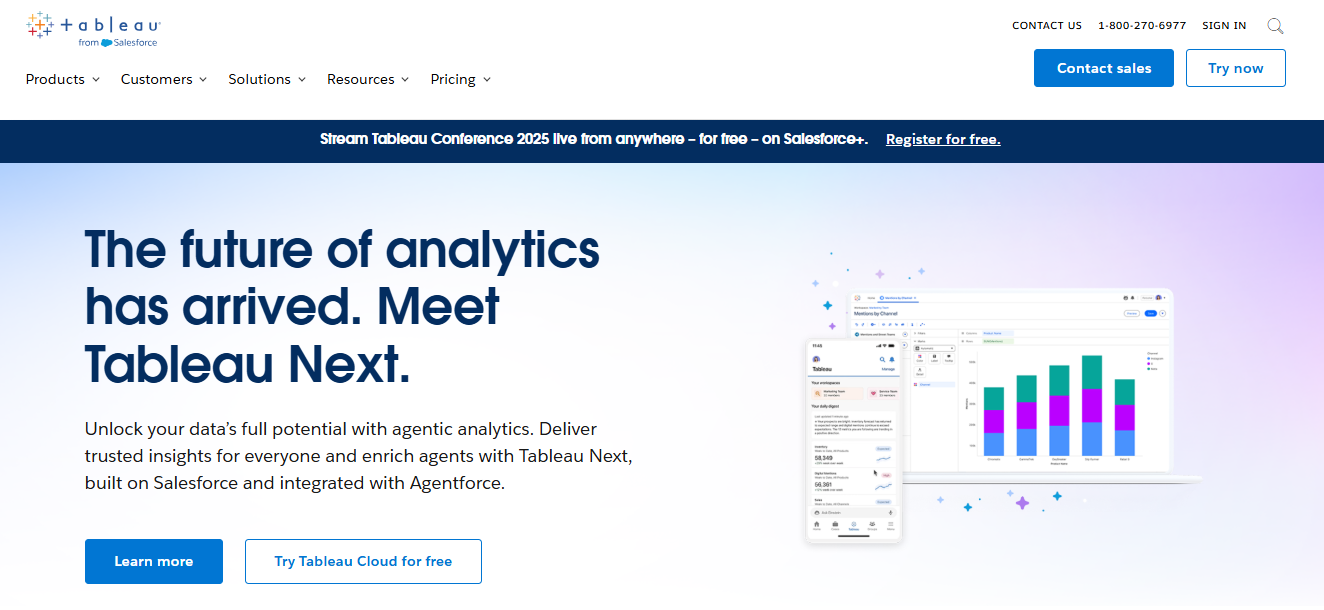
Tableau, a leading big data analytics tool acquired by Salesforce, empowers users to visualize and analyze data effectively. Its intuitive drag-and-drop interface enables the creation of interactive dashboards, providing valuable insights into critical KPIs. However, navigating Tableau can be challenging for business users without an analytical background.
At its core, Tableau offers several key features that make it a powerful analytics platform. Data Visualization is a standout feature, transforming complex data into easy-to-understand visuals such as charts, graphs, and maps. Data Connectivity is another strong point, allowing users to connect to a wide range of data sources, including SQL databases, cloud services like Google Analytics, and big data platforms like Hadoop. This integration provides a comprehensive view of business metrics across different systems.
Additionally, Tableau is accessible on various devices, making it simple to view and interact with dashboards on desktops, tablets, or mobile devices. The platform also supports Report Sharing and Collaboration, enabling users to share insights and collaborate with others seamlessly. Furthermore, Tableau ensures App-Level Security, protecting data with robust security measures to safeguard sensitive information. These features collectively make Tableau a versatile tool for data-driven decision-making across organizations.
Zoho Analytics
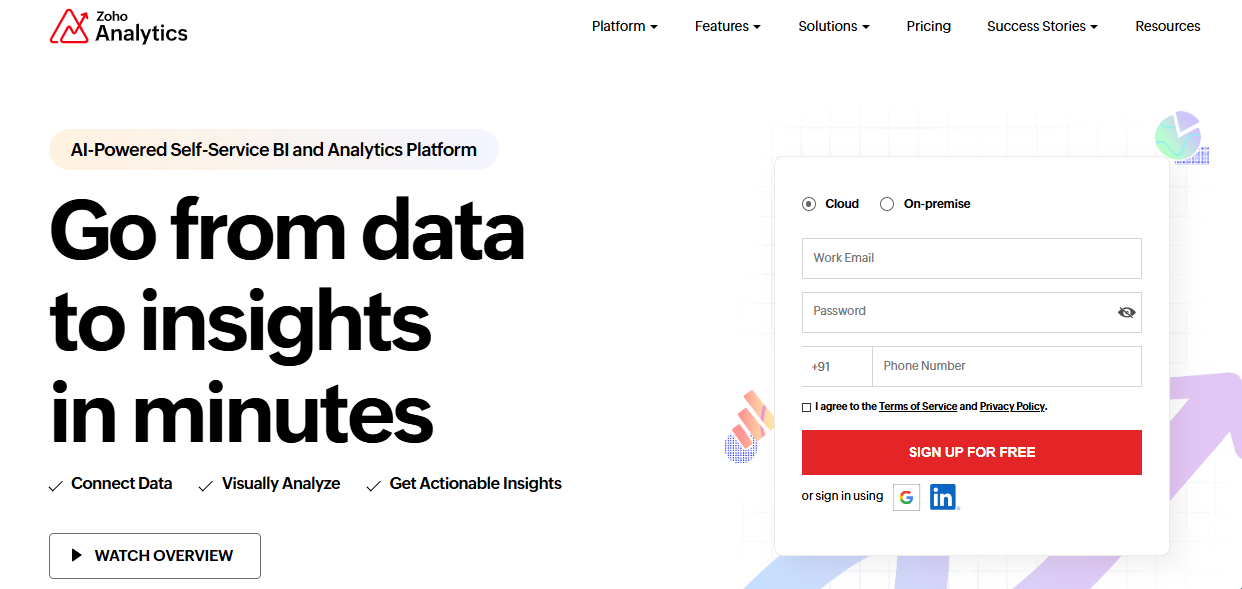
Zoho Analytics is a modern self-service business intelligence (BI) and analytics platform that empowers businesses to analyze their data effectively. It integrates with over 250 data sources, allowing users to unify data from various applications and create insightful reports and dashboards. With its intuitive drag-and-drop interface, users can easily visualize data and derive meaningful insights without needing extensive IT support.
At its core, Zoho Analytics offers several key features that make it a powerful analytics tool. Data Visualization and Reporting is a standout feature, converting complex data into easy-to-understand visuals such as charts, graphs, and dashboards. It supports multiple visualization types, including tabular views, summary views, and pivot tables, making it simple to present data insights clearly.
Zoho Analytics includes AI-Powered Insights through Zia, a smart AI assistant that provides insights and answers to data queries in natural language. This feature streamlines data analysis by offering quick and actionable insights directly within the platform.
Sisense
Sisense is a comprehensive business intelligence (BI) and data analytics platform designed to help organizations gather, analyze, and visualize data from diverse sources. It offers a user-friendly interface that simplifies complex data, transforming it into actionable insights and powerful analytic apps. Sisense supports both cloud-based and on-premise deployments, providing flexibility in how businesses manage their data environments.
Sisense connects to a wide range of data sources, including databases, spreadsheets, cloud services, and web applications. It offers robust data preparation tools to clean, transform, and shape data for analysis, ensuring that data is consistent and reliable.
Sisense allows businesses to embed AI-powered analytics directly into their applications or services, offering pro-code, low-code, and no-code capabilities. This feature is particularly useful for software companies and organizations seeking to provide data-driven insights to their users.
Qlik
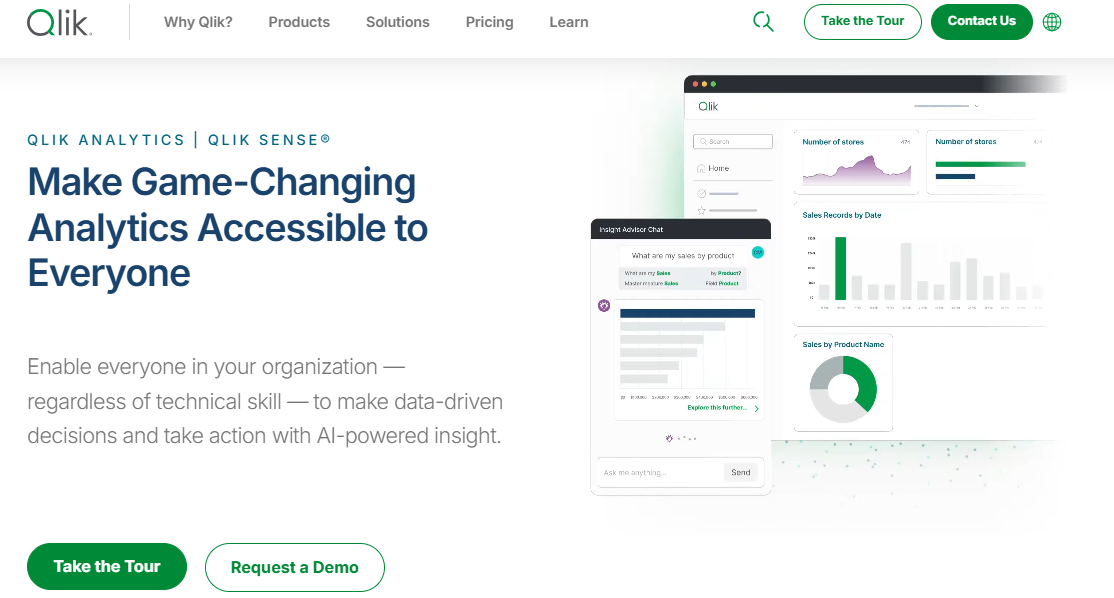
Qlik Sense is a powerful analytics platform that empowers business users to apply advanced data analytics techniques to large datasets. It supports both on-premise and cloud deployments, offering flexibility in how organizations manage their data environments. With Qlik Sense, users can build interactive visualizations, receive data-driven recommendations, and monitor data in real-time, ensuring that insights are always current and actionable.
At its core, Qlik Sense offers several key features that make it a robust tool for data analysis. Data Visualization and Reporting is a standout feature, converting complex data into interactive visuals that provide easy-to-understand insights. Additionally, Qlik Sense supports Real-Time Monitoring, allowing users to track data as it changes, ensuring that information remains up-to-date. The platform also excels in Data Modeling, organizing and connecting data from diverse sources to facilitate deeper analysis.
Qlik Sense further enhances collaboration with its Sharing and Collaboration capabilities, enabling users to share reports and work together on data insights seamlessly. Moreover, it offers Embedded Analytics, integrating analytics directly into applications or workflows. This feature streamlines decision-making by providing relevant data insights at the point of action, eliminating the need to switch between different tools or interfaces. Overall, Qlik Sense is designed to support data-driven decision-making across organizations by making analytics accessible, interactive, and actionable.
ThoughtSpot
ThoughtSpot is an AI-powered analytics platform that revolutionizes data discovery and empowers users to access valuable insights for better decision-making. It simplifies complex data analysis by providing a user-friendly interface that allows users to query data using natural language, similar to a search engine. This approach makes it accessible to users of all skill levels, transforming the way organizations leverage their data.
ThoughtSpot’s AI analyst, Spotter, enables users to ask questions in natural language and receive immediate answers. This conversational interface uses advanced semantic models and human feedback to deliver precise, contextual insights that can be understood and modified without requiring technical expertise.
ThoughtSpot allows users to embed analytics into existing applications, creating tailored analytical experiences for users. It integrates seamlessly with cloud ecosystems and enterprise SaaS offerings, providing actionable insights and data-driven workflows.