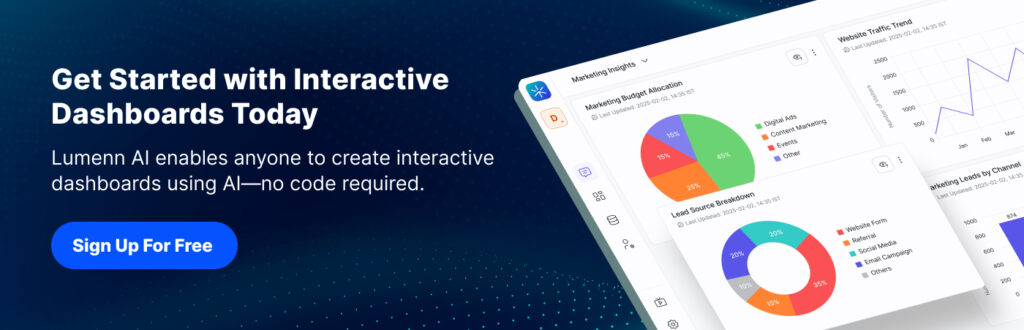

In today’s data-driven world, dashboards are no longer a luxury—they’re a necessity. But for many teams, building interactive dashboards still means relying on technical BI tools, complex SQL queries, and long development cycles. This slows down decision-making and limits who can truly work with data.
AI-powered, no-code analytics platforms are changing this completely.
In this blog, we’ll explore how to create interactive dashboards using AI—without writing a single line of code, and how modern platforms like Lumenn AI make dashboard creation accessible to everyone.
Why Traditional Dashboard Creation Falls Short
Traditional dashboard tools were designed for analysts and developers. While powerful, they come with several challenges:
- Heavy dependence on IT or BI teams
- Long turnaround times for new dashboards or changes
- Complex interfaces and steep learning curves
- Static dashboards that don’t adapt easily to new questions
As a result, business users often wait days—or weeks—for insights that are needed immediately.
The Rise of AI-Powered, No-Code Dashboards
AI has transformed how dashboards are created and consumed. Instead of manually selecting fields, writing queries, and designing layouts, AI-driven platforms allow users to:
- Ask questions in natural language
- Automatically generate the right visualizations
- Build dashboards incrementally from insights
- Refresh and update dashboards in real time
Most importantly, no-code dashboards remove technical barriers, empowering non-technical users to explore data independently.
End-to-End Flow: Creating Dashboards in Lumenn AI
This guide walks you through the complete process of creating interactive dashboards in Lumenn AI—from connecting data to building and sharing dashboards.
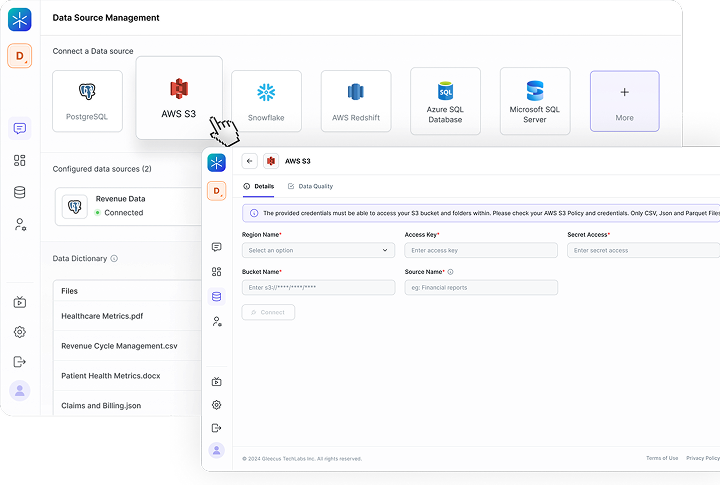
Step 1: Connect a Data Source
Before analysis can begin, you must connect your data.
- Log in to Lumenn AI and open your Workspace.
- Navigate to Data Sources from the left menu.
- Click Connect Data Source.
- Select your data connector (e.g., Snowflake, PostgreSQL, BigQuery, AWS S3).
- Enter connection details and click Test Connection.
- Once verified, click Connect and select the required tables or files.
Your data is now securely available for analysis.
Step 2: Add a Data Dictionary (Recommended)
Adding a Data Dictionary helps Lumenn AI understand your business context.
- Go to Data Sources
- Open the Data Dictionary section.
- Click Upload Dictionary.
- Upload a PDF, DOC, or CSV containing business definitions and metrics.
- Save your changes.
This ensures more accurate queries and reduces ambiguity in analysis.

Step 3: Start Analysis Using Natural Language or AI Auto Analyst
Once your data is ready, begin exploring insights.
Option A: Natural Language Query
- Go to Chats & Threads.
- Click New Thread.
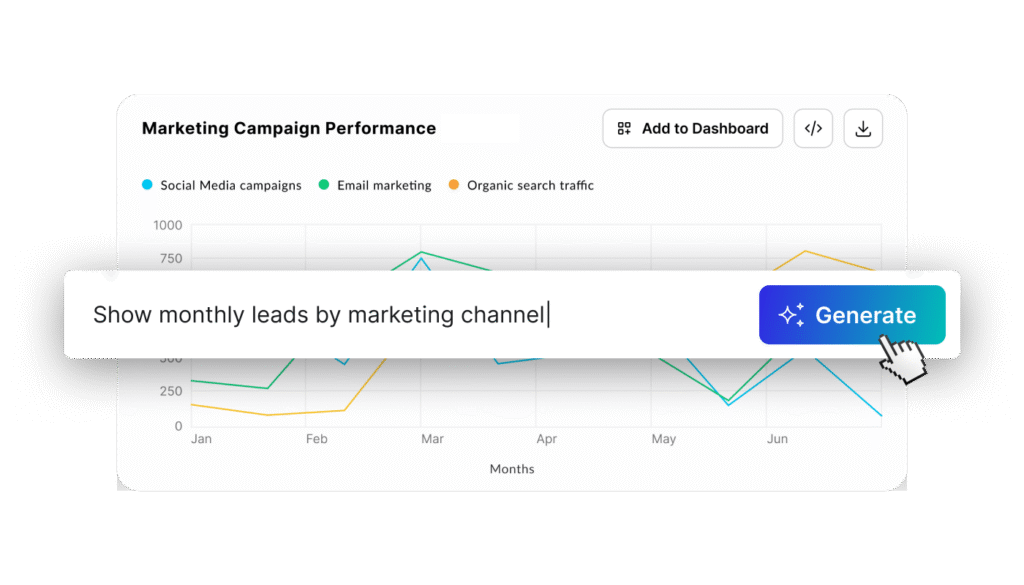
- Ask a question in plain English (e.g., “Show revenue trends by region”).
- Click Generate to view insights and visualizations.
Option B: Use AI Auto Analyst (Suggested Queries)
- Click New Thread.
- Review the Auto Analyst suggested queries generated automatically.
- Select a relevant query.
- Click Generate to explore the results.
Both methods produce visualizations and explanations you can build on.

Step 4: Build Dashboards from Insights (Not Templates)
Unlike traditional BI tools, dashboards in AI-powered platforms are built organically.
Here’s how it works:
- Each visualization generated in a chat or thread can be added to a dashboard
- The first added visualization creates the dashboard
- Additional insights from any thread can be added to the same dashboard
This approach ensures dashboards are:
- Insight-driven, not template-driven
- Easy to evolve over time
- Aligned with real business questions
Step 5: Customize Layout and Interactions
Once visualizations are added, dashboards can be refined easily:
- Drag and drop charts to rearrange
- Resize visuals for clarity
- Combine charts from multiple analyses
Everything is no-code and saves automatically.
Step 6: Keep Dashboards Always Up to Date
Interactive dashboards are only useful if they reflect current data.
AI-powered dashboards support both:
Auto Refresh
- Set refresh intervals per visualization (e.g., every 4, 8, 16, or 24 hours)
- Dashboards update automatically as source data changes
Manual Refresh
- Instantly refresh any visualization with a single click
- Useful after data updates or immediate checks
This ensures dashboards always show the latest insights.
Step 7: Share and Collaborate Securely
Once dashboards are ready, sharing is simple:
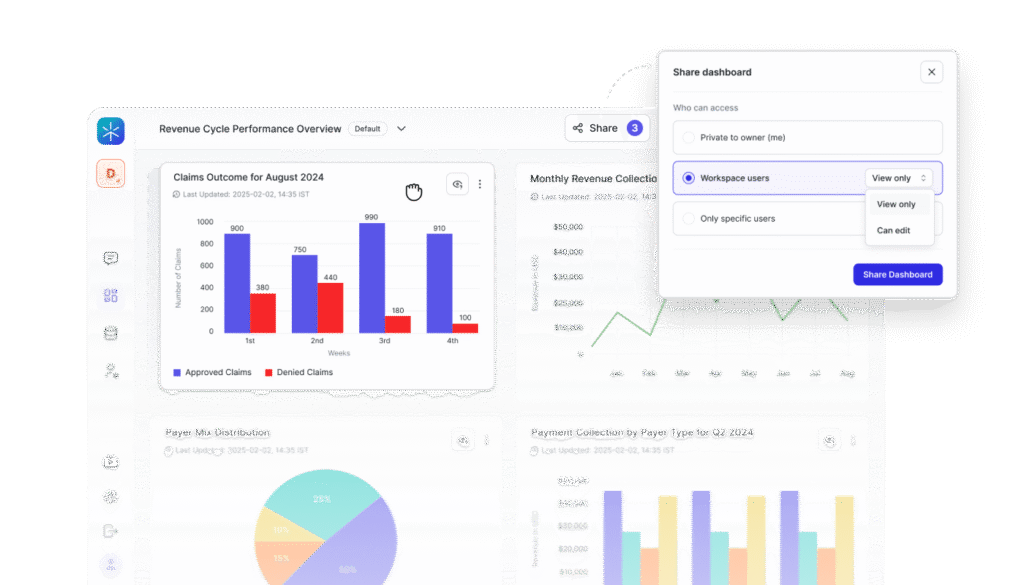
- Share dashboards with same workspace members or other users in the organization
- Assign Viewer or Editor access
- Collaborate across teams without exporting data
Dashboards can also be exported as:
- Excel
- Image formats
This makes it easy to use insights in presentations, reports, and reviews.
Why No-Code AI Dashboards Matter for Businesses
No-code AI dashboards deliver real business impact:
- Faster decisions: Insights are available instantly
- Lower costs: Reduced dependency on BI and engineering teams
- Wider adoption: Everyone can work with data, not just analysts
- Better governance: Centralized dashboards with controlled access
- Continuous insights: Always-on analytics, not one-off reports
For enterprises, this means analytics becomes a daily tool—not a bottleneck.
Who Benefits Most from AI-Powered Dashboards?
- Business leaders tracking KPIs in real time
- Sales teams monitoring performance and pipelines
- Finance teams analyzing revenue, costs, and forecasts
- Operations teams identifying trends and inefficiencies
- Non-technical users who need insights without complexity