
Modern manufacturing floors generate enormous amounts of data every day. Machines record production cycles, sensors capture equipment conditions, operators log activities, and quality systems track defects and deviations.
The challenge is no longer collecting shop floor data. It is turning that data into insights that teams can actually use.
For manufacturing leaders, the real opportunity lies in connecting operational data with everyday decisions. When teams can quickly understand production performance, identify bottlenecks, detect anomalies, and compare equipment or operator performance, shop floor data becomes more than a record of what happened. It becomes a tool for improving what happens next.
What Is Shop Floor Data?
Shop floor data refers to the information generated by manufacturing operations. It can include machine performance, production volumes, downtime, cycle times, quality measurements, operator activity, maintenance records, inventory movement, and production schedules.
This data can come from manufacturing execution systems, enterprise resource planning platforms, industrial equipment, sensors, quality systems, and operational databases.
When analyzed together, these data points can provide a detailed picture of how a production environment is performing.
Why Manufacturing Teams Struggle to Use Shop Floor Data
Manufacturers often have plenty of data but limited visibility.
Production information may be spread across multiple systems, making it difficult to create a complete picture of operations. Teams may also rely on manually prepared reports that show what happened yesterday rather than what is happening now.
Another challenge is accessibility. A plant manager may understand the business question but not SQL or complex BI tools. Getting a simple answer can therefore require support from analysts or data teams.
This creates a gap between having data and being able to act on it.
Turning Shop Floor Data into Actionable Insights
The value of manufacturing analytics comes from connecting operational questions with meaningful answers. Here are some of the areas where shop floor data can make the biggest difference.
Monitor Production Performance
Manufacturing teams need a clear view of production output across machines, lines, shifts, and facilities.
Instead of manually comparing spreadsheets, teams can analyze production data to understand output trends, identify underperforming lines, and compare actual production against targets.
Questions such as “Which production lines had the highest output this month?” can help teams quickly identify performance differences and areas that require attention.
Identify Equipment Downtime
Unplanned downtime can affect production schedules, capacity, and operating costs.
By analyzing machine downtime data, teams can identify which equipment experiences the most interruptions, when downtime occurs, and whether certain machines consistently underperform.
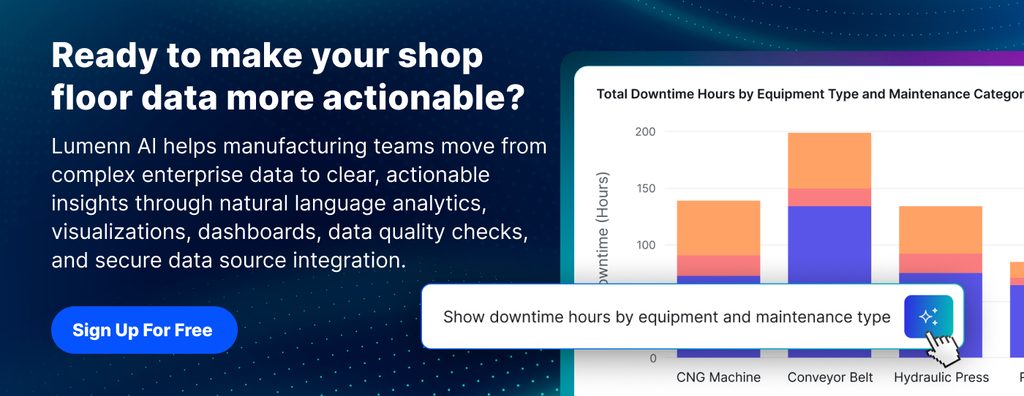
A question such as “Which machines had the highest downtime last quarter?” can turn operational data into a starting point for maintenance and process improvement.
Analyze Quality and Defects
Quality data can reveal patterns that are difficult to spot through isolated reports.
Manufacturers can analyze defects by product, production line, machine, shift, location, or time period. This helps quality teams investigate recurring issues and identify where corrective action may have the greatest impact.
For example, asking “Which production lines have the highest defect rate?” can quickly highlight areas that deserve deeper investigation.
Understand Cycle Time
Cycle time directly affects production capacity and efficiency.
Analyzing cycle time across machines, products, and shifts can help manufacturing teams identify processes that take longer than expected and understand where production is losing time.
With the right analytics, teams can move beyond simply measuring cycle time to understanding the operational factors contributing to it.
Compare Plant and Operator Performance
Manufacturing organizations often operate multiple facilities and shifts. Comparing performance across them can reveal opportunities to replicate successful processes.
Teams can analyze production output, downtime, quality, and efficiency by plant, shift, or operator group to understand where performance differs and why.
This creates a more consistent approach to operational improvement.
From Data Questions to Faster Decisions
The biggest change in modern manufacturing analytics is not simply having more dashboards. It is making analytics accessible when decisions need to be made.
Natural language analytics allows users to ask questions about operational data without needing to write SQL or navigate complex reporting tools.
A plant manager could ask:
“Show production output by shift for the last 30 days.”
Or:
“Which machines experienced increasing downtime this quarter?”
The goal is not to replace manufacturing expertise. It is to give that expertise faster access to the information needed to act.
Why Real-Time Manufacturing Analytics Matters
Manufacturing environments change continuously. Production targets shift, equipment performance changes, quality issues emerge, and supply conditions evolve.
Analytics based on outdated information can lead to delayed decisions.
Real-time or regularly refreshed manufacturing analytics helps teams work with current operational information. Leaders can monitor KPIs, investigate emerging patterns, and respond before small issues become larger operational problems.
For manufacturers, the ability to move from “What happened?” to “What is happening?” and eventually “What should we investigate next?” can create significant value.
Breaking Down Data Silos Across Manufacturing
Shop floor data rarely exists in isolation.
Production data may need to be understood alongside inventory, sales, maintenance, quality, or financial information. Connecting these sources can provide a more complete view of operational performance.
For example, a production slowdown may look like an equipment problem until it is analyzed alongside maintenance records or inventory availability.
This is why modern manufacturing analytics needs secure access to multiple enterprise data sources rather than isolated reporting from individual systems.
How Lumenn AI Helps Manufacturing Teams
Lumenn AI brings conversational enterprise analytics to manufacturing teams, helping users explore operational data using natural language.
Manufacturing teams can connect their enterprise data sources and ask questions about production, equipment, quality, operations, and performance without needing to write SQL.
Ask Questions in Natural Language
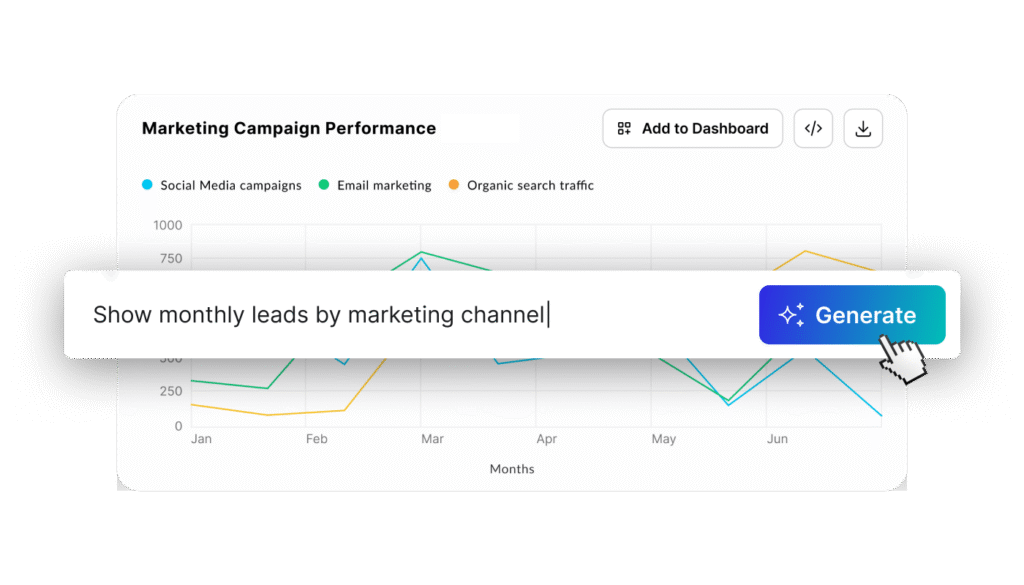
Users can ask questions in plain English and receive visualizations, tables, and text-based insights. This makes shop floor analytics accessible to plant managers, operations leaders, and business teams without requiring extensive BI expertise.
Build Manufacturing Dashboards
Teams can add generated visualizations to dashboards and organize important operational metrics in one place. Dashboards can be shared with relevant stakeholders and refreshed based on business requirements.

Explore Data Quality
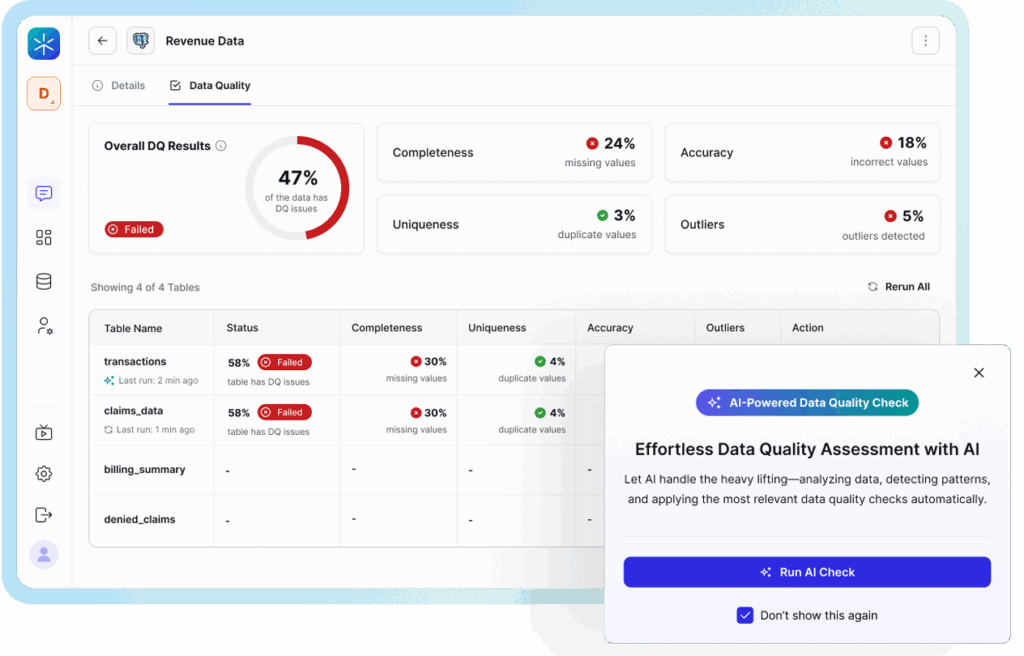
Reliable manufacturing decisions depend on reliable data. Lumenn AI provides AI-powered data quality checks that can identify issues such as nulls, duplicates, inconsistencies, and anomalies, helping teams understand data quality before relying on it for analysis.
Connect Data Where It Already Lives
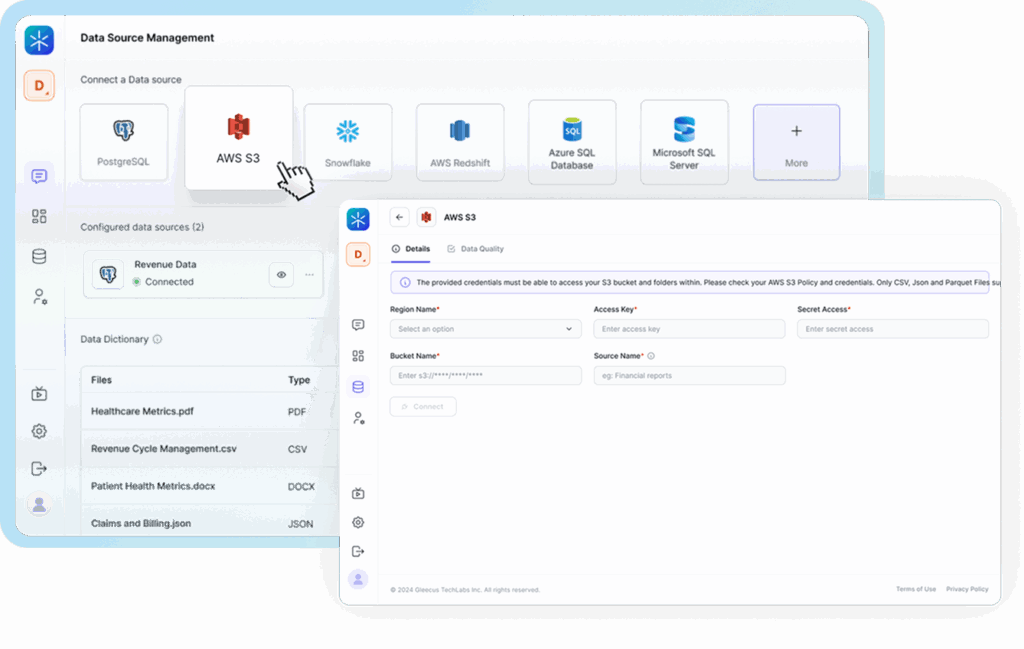
Lumenn AI connects with enterprise data sources such as PostgreSQL, MySQL, Snowflake, Amazon Redshift, Google BigQuery, Azure SQL, AWS S3, and Azure Blob Storage. With secure read access and in-place querying, organizations can analyze data without moving it into another environment.
The Future of Shop Floor Analytics Is More Accessible
Manufacturing analytics does not have to remain the responsibility of specialized data teams.
As AI and natural language interfaces make data exploration easier, more people across manufacturing organizations can participate in data-driven decision-making.
The plant manager can investigate production performance. The quality team can explore defect patterns. Operations leaders can compare facilities. Executives can monitor critical KPIs.
The result is a more connected relationship between operational data and the people responsible for acting on it.