
Supply chains rarely fail because of one major problem. A shipment arrives late, a supplier misses a deadline, inventory falls below expectations, or demand suddenly changes. Individually, these events may seem manageable. Together, they can disrupt production, increase costs, and affect customer satisfaction.
The challenge for supply chain teams is not a lack of data. It is knowing where the risk is, why it is happening, and what needs attention first.
This is where enterprise analytics can make a significant difference.
By bringing together data from suppliers, inventory systems, logistics platforms, warehouses, sales, and operations, enterprise analytics gives supply chain teams a clearer view of performance and emerging risks. Instead of relying on disconnected reports and spreadsheets, teams can explore live business data and identify potential delays before they become larger operational problems.
What Is Supply Chain Analytics?
Supply chain analytics is the process of using data to understand, monitor, and improve supply chain performance.
It can help organizations analyze areas such as:
- Supplier performance
- Shipment and delivery times
- Inventory levels
- Warehouse operations
- Purchase orders
- Production schedules
- Transportation performance
- Demand patterns
- Order fulfillment
Modern enterprise analytics goes beyond displaying these metrics on dashboards. With AI and natural language analytics, teams can ask questions directly about their supply chain data and quickly explore the results.
For example:
“Which suppliers have the highest delivery delays this quarter?”
“Show shipment delays by region over the last six months.”
“Which products are at the highest risk of stockout?”
These questions can help teams move from simply monitoring supply chain performance to actively investigating what is changing.
Why Supply Chain Delays Are Difficult to Detect
Supply chain data is often distributed across multiple systems. Supplier information may exist in procurement software, shipment data in logistics systems, inventory information in ERP platforms, and customer demand data in sales systems.
When these sources remain disconnected, identifying the cause of a delay can take time.
A shipment may be late because of supplier performance, transportation issues, inventory shortages, or an earlier disruption that occurred elsewhere in the supply chain. Looking at one dataset alone may not reveal the complete picture.
Enterprise analytics helps teams connect these signals and explore them together.
How Enterprise Analytics Helps Identify Supply Chain Delays
1. Monitor Supplier Performance
Supplier reliability is one of the most important indicators of supply chain health.
Enterprise analytics can help teams compare suppliers based on delivery performance, order fulfillment, lead times, and other operational metrics.
Instead of reviewing supplier reports manually, teams can ask questions such as:
“Which suppliers have missed delivery targets most frequently?”
The resulting analysis can highlight underperforming suppliers and help procurement teams prioritize follow-up.
2. Identify Shipment and Transportation Delays
Transportation delays can quickly affect downstream operations.
Analytics can help teams examine delivery times by carrier, route, region, shipment type, or time period. Comparing these patterns can reveal where delays are concentrated.
For example, a supply chain manager might ask:
“Which routes experienced the most delivery delays in the last quarter?”
This can help identify recurring bottlenecks and support better transportation planning.
3. Detect Inventory Risks
Inventory shortages can create a chain reaction. A delayed replenishment can lead to lower stock levels, which can eventually affect production or customer fulfillment.
Enterprise analytics enables teams to monitor inventory trends and identify products, warehouses, or locations that may require attention.
Questions such as “Which products are approaching their minimum stock levels?” can help teams investigate potential stockout risks before they become critical.
4. Find Bottlenecks Across Operations
A delay in one part of the supply chain can create problems elsewhere.
Analytics can help organizations compare operational metrics across warehouses, suppliers, production facilities, and distribution centers. This makes it easier to identify locations or processes where performance consistently falls behind.
Instead of asking only whether a shipment was delayed, teams can investigate the bigger question:
“Where in our supply chain are delays occurring most frequently?”
That broader perspective can reveal recurring bottlenecks that may otherwise remain hidden.
5. Analyze Trends Before They Become Problems
One delayed shipment may not indicate a major issue. A pattern of increasing delays could.
Enterprise analytics allows teams to analyze historical and current data to identify changes in performance over time. Increasing supplier lead times, rising transportation delays, or declining inventory levels can become important warning signals.
The earlier these patterns are identified, the more time teams have to respond.
From Supply Chain Visibility to Risk Management
Identifying a delay is useful. Understanding the risk behind it is even more valuable.
Supply chain teams can use analytics to investigate relationships between different operational indicators. For example, increasing supplier lead times combined with declining inventory levels could indicate a potential fulfillment risk.
This changes the role of analytics from reporting what happened to helping teams understand what deserves attention next.
Questions Supply Chain Teams Can Ask
Natural language analytics can make supply chain exploration more accessible. Teams can ask:
“Which suppliers have the highest delay rate?”
“Show delivery performance by region.”
“Which warehouses have experienced increasing fulfillment delays?”
“What products have declining inventory levels?”
“Which carriers have the longest average delivery times?”
“Show monthly shipment delays for the past year.”
These questions can turn complex supply chain datasets into understandable charts, tables, and insights.
Why Real-Time Supply Chain Analytics Matters
Supply chain conditions can change quickly. A dashboard based on yesterday’s data may not provide enough context for today’s decision.
Modern enterprise analytics platforms can connect directly to existing data sources and query information where it already resides. This gives teams a more current view of operational performance without requiring unnecessary data movement.
With fresher data, supply chain leaders can investigate emerging issues sooner and make decisions based on the latest available information.
How Lumenn AI Helps Supply Chain Teams
Lumenn AI brings conversational enterprise analytics to supply chain operations, helping teams explore complex business data without relying on SQL or lengthy reporting cycles.
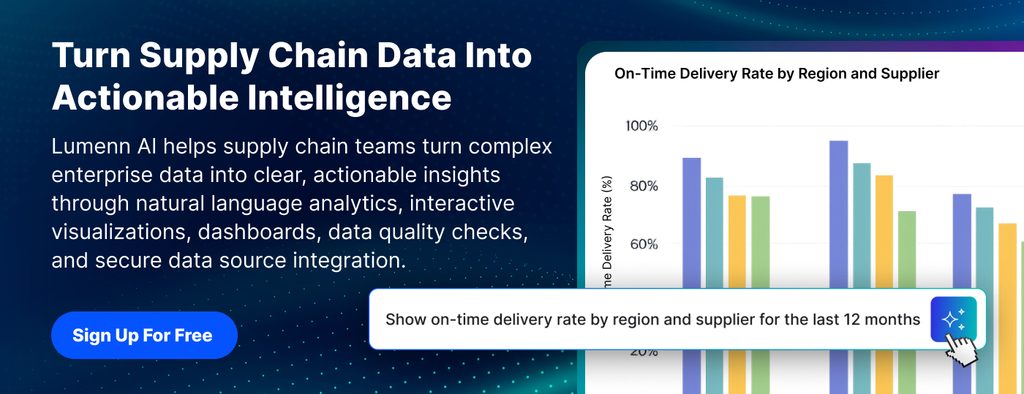
Teams can connect their enterprise data sources and ask questions in natural language. Lumenn AI transforms those questions into visualizations and textual insights, making it easier to investigate supplier performance, shipment delays, inventory trends, and operational metrics.
Ask Questions in Plain English
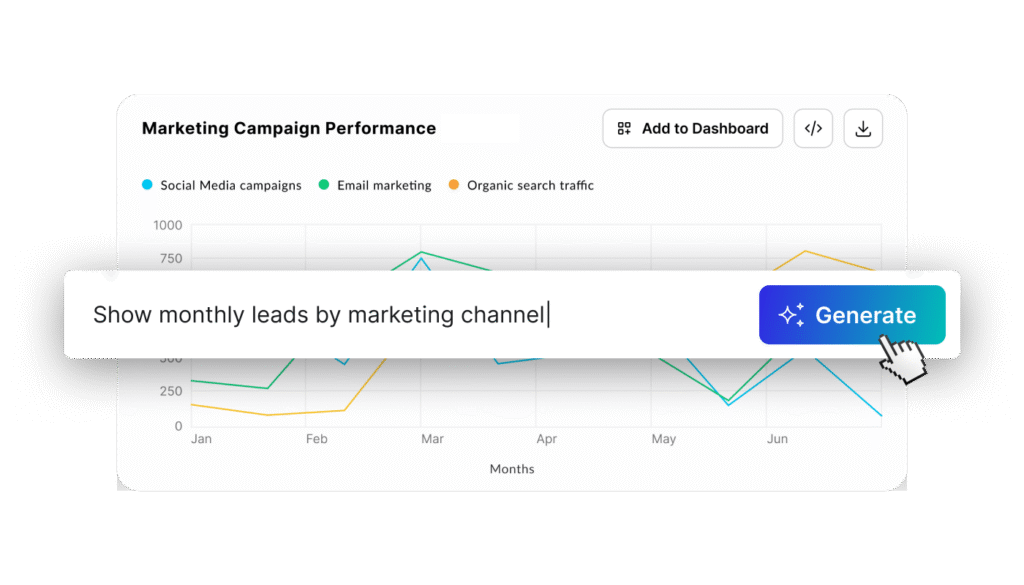
Supply chain users can ask questions such as:
“Show supply chain delays by vendor in the past month.”
Lumenn AI can turn the request into an understandable visualization and supporting insight, helping users quickly identify areas that require attention.
Explore Multiple Data Sources
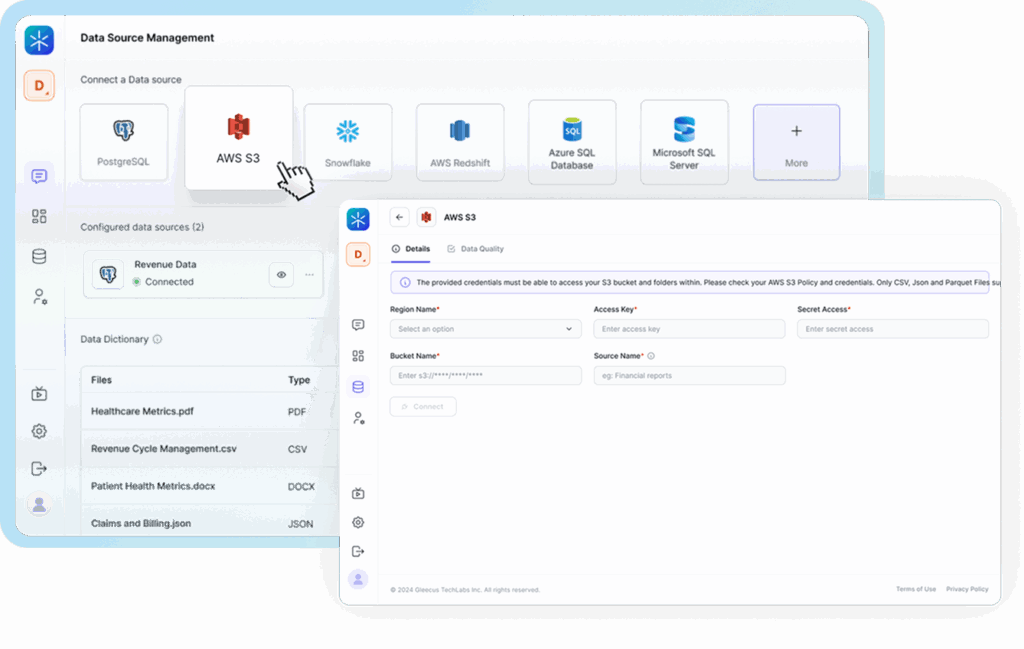
Supply chain information often spans multiple systems. Lumenn AI supports connections to enterprise data sources including PostgreSQL, MySQL, Snowflake, Amazon Redshift, Google BigQuery, Azure SQL, AWS S3, and Azure Blob Storage.
This allows teams to explore their enterprise data without requiring them to move everything into another environment.
Build Supply Chain Dashboards
Once teams generate useful visualizations, they can add them to dashboards to create a centralized view of important supply chain metrics.
Dashboards can help teams monitor supplier performance, inventory levels, shipment delays, and other operational indicators in one place. Visualizations can also be refreshed automatically or manually to keep information current.

Improve Confidence in Supply Chain Data
Analytics is only as useful as the data behind it. Lumenn AI provides AI powered data quality checks that can identify issues such as nulls, duplicates, inconsistencies, and anomalies.
This helps supply chain teams identify potential data problems before they influence business decisions.
The Future of Supply Chain Analytics Is More Conversational
Supply chain teams have access to more data than ever, but having more data does not automatically create better visibility.
The real advantage comes from making that data easier to explore and act upon.
Enterprise analytics can help supply chain teams move beyond static reports and investigate operational questions as they arise. By combining data from across the supply chain with AI powered analysis and natural language interaction, organizations can identify delays, uncover risks, and respond with greater confidence.
The goal is not simply to know that a shipment is late.
It is to understand why it is late, what it could affect, and where to look next.