
Financial leaders need more than numbers. They need a clear view of what is happening across revenue, expenses, profitability, cash flow, and business performance so they can make confident decisions quickly.
Yet building executive finance dashboards has traditionally required analysts, SQL expertise, multiple reporting tools, and constant manual updates.
No code analytics is changing that.
With modern AI-powered analytics platforms, finance teams can move from manually preparing reports to asking questions in natural language, creating meaningful visualizations, and bringing critical financial metrics together in one place.
Why Executive Finance Dashboards Matter
An executive finance dashboard turns complex financial data into a focused view of business performance. Instead of reviewing spreadsheets and reports across different systems, leadership can monitor the metrics that matter most from a centralized dashboard.
A well-designed finance dashboard can provide visibility into:
- Revenue and revenue growth
- Gross and operating margins
- Accounts receivable and payable
- Expenses and cost trends
- Cash flow
- Budget versus actual performance
- Regional or business unit performance
- Sales and profitability trends
The objective is not to display every available metric. It is to give decision makers the right information at the right time.
The Challenge with Traditional Finance Dashboards
Creating executive dashboards can become a lengthy process. Finance teams often depend on analysts or BI specialists to extract data, write queries, build charts, and update reports.
Too Much Dependence on Technical Teams
A simple request such as “Show operating expenses by region for the last six quarters” can require data extraction, SQL development, validation, visualization, and reporting.
This dependency slows down financial analysis and makes it harder for executives to explore follow up questions.
Data Is Spread Across Multiple Systems
Financial information rarely exists in one place. ERP systems, databases, CRM platforms, spreadsheets, and cloud data warehouses can all contain important pieces of the financial picture.
Bringing these sources together for reporting can add significant complexity.
Static Reports Become Outdated
Finance leaders need current information, but manually refreshed reports can quickly become outdated. When business conditions change, decisions based on yesterday’s numbers may no longer reflect reality.
What No Code Analytics Brings to Finance
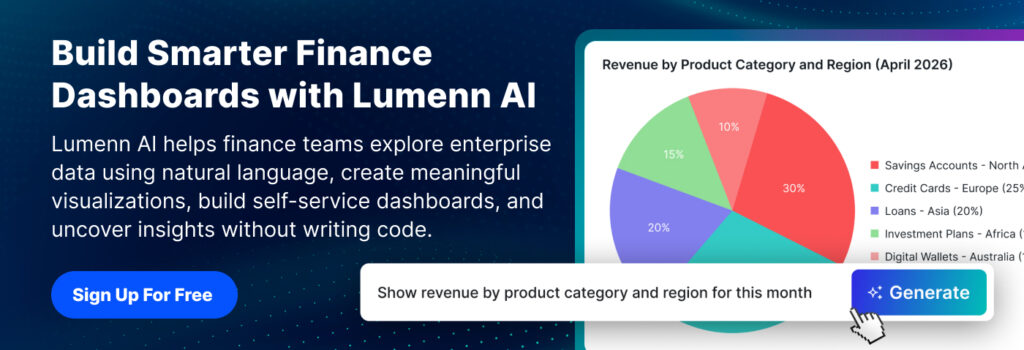
No code analytics removes much of the technical complexity involved in exploring business data. Instead of writing SQL or building every visualization manually, users can interact with data using natural language.
For example, a finance leader could ask:
“Show monthly revenue and operating expenses for the last 12 months.”
The analytics platform can interpret the request, query the relevant data, and generate an appropriate visualization.
The user can then continue exploring the result with additional questions rather than starting a new reporting process.
How to Build an Executive Finance Dashboard with No Code Analytics
1. Connect Your Financial Data
Start by connecting the data sources that contain your financial information. This could include enterprise databases, cloud data warehouses, or other supported business data sources.
The goal is to make relevant financial data accessible for analysis without creating unnecessary copies or manual exports.
2. Ask Financial Questions in Natural Language
Once your data is connected, start with the business questions executives actually care about.
Examples include:
- “What was our revenue growth by quarter?”
- “Which business unit has the highest operating margin?”
- “Show expenses by category for this year.”
- “Compare actual revenue with the previous year.”
- “Which regions experienced the largest increase in costs?”
Natural language analytics allows finance professionals to explore these questions without needing to write SQL.
3. Turn Answers into Visualizations
Numbers become easier to understand when presented visually. No code analytics can transform queries into charts, tables, and other visual formats that make trends and comparisons easier to interpret.
For executive finance dashboards, visualizations can help highlight revenue movement, expense growth, profitability changes, and performance differences across business units.
4. Bring Key Visualizations Together
Once you have generated the visualizations you need, organize them into an executive dashboard.
A finance dashboard might include revenue performance at the top, followed by profitability, expenses, cash flow, and regional performance.
This creates a single view that leadership can use to monitor business performance without moving between multiple reports.
5. Keep the Dashboard Current
Executive decisions depend on current information. Modern dashboards can support automated refresh schedules as well as manual refresh when users need the latest available data immediately.
This reduces the need for finance teams to repeatedly rebuild or distribute updated reports.
What Should an Executive Finance Dashboard Include?
A strong dashboard should answer the questions leadership asks most frequently.
Revenue Performance
Track total revenue, growth rates, regional performance, product performance, and changes over time to understand whether the organization is meeting its growth objectives.
Profitability
Monitor gross margin, operating margin, profit trends, and profitability across products, regions, or business units.
Expense Management
Analyze spending patterns and identify categories, departments, or regions where costs are increasing faster than expected.
Cash Flow
Give leadership visibility into cash inflows, outflows, and broader cash flow trends to support financial planning and operational decisions.
Budget Versus Actuals
Compare planned financial performance with actual results to identify significant variances and understand where the business is exceeding or missing expectations.
Why Lumenn AI for Executive Finance Dashboards?
Lumenn AI brings no code analytics and AI powered data exploration together to help finance teams turn enterprise data into actionable insights.
With Lumenn AI, users can connect enterprise data sources, ask questions in natural language, generate visualizations, and organize those insights into dashboards without relying on complex BI workflows.
Its AI powered approach also helps users explore data more proactively. The Auto Analyst can suggest relevant questions based on available data, helping teams discover insights they may not have thought to ask.
Lumenn AI also supports Data Quality checks to help identify issues such as nulls, duplicates, inconsistencies, and anomalies before they affect analysis. With Data Dictionary support, organizations can provide business context to help the AI understand their terminology and metrics more accurately.
For finance teams, this means less time spent preparing reports and more time spent understanding what the numbers mean.

From Financial Reporting to Financial Intelligence
An executive finance dashboard should do more than display yesterday’s numbers. It should help leadership understand what is changing, where attention is needed, and what questions should be explored next.
No code analytics makes this approach accessible beyond technical teams. Finance professionals can move from a question to an insight, from an insight to a visualization, and from multiple visualizations to a decision ready dashboard.
The future of financial analytics is not about building more reports. It is about making enterprise data easier to explore, understand, and act on.