In the modern enterprise, data changes by the second, and so should your insights. Waiting for static reports or end-of-day summaries often means reacting too late. A Real-time Dashboard eliminates that delay by transforming live data streams into instantly actionable insights.
In this article, we’ll explore what Real-time Dashboards are, how they work, their business value, and how Lumenn AI helps organizations make faster, smarter decisions.
What Is a Real-time Dashboard?
A Real-time Dashboard is an interactive visualization panel that automatically updates as new data flows into your system. Unlike traditional dashboards that refresh hourly or daily, Real-time Dashboards display metrics within seconds, offering a continuous pulse of your business performance.
They consolidate key data—sales, operations, finance, and marketing into a single live interface. Whether tracking product sales or monitoring operations, teams get instant visibility into what’s happening right now.
Key features of a Real-time Dashboard include:
- Live data refresh and auto-update capabilities
- Configurable alerts for anomalies or threshold breaches
- Cross-source data integration for unified insights
- Custom visualizations like bar charts, combo graphs, and KPIs
- Secure, role-based access for enterprise governance
Key Components of an Effective Real-time Dashboard
Building an effective Real-time Dashboard requires the right mix of data, design, and intelligence.
| Component | Purpose |
|---|---|
| Live Data Integration | Connect multiple data sources securely and update instantly |
| Visualization Layer | Present information through dynamic, easy-to-read charts and graphs |
| AI-Driven Insights | Detect trends, anomalies, or outliers automatically |
| Alerting Mechanisms | Trigger notifications when metrics breach thresholds |
| Access Control | Ensure only authorized users can view or modify dashboards |
Designing a Real-time Dashboard That Works
A well-structured Real-time Dashboard focuses on clarity, speed, and context. Here’s how to design one that drives results:
- Choose Relevant KPIs: Highlight metrics that directly impact your objectives.
- Optimize for Speed: Use in-place queries to minimize latency and maintain data freshness.
- Keep It Simple: Avoid clutter—limit dashboards to 5–7 critical KPIs.
- Use Smart Visual Hierarchy: Prioritize visuals by importance, not quantity.
- Enable Drill-Downs: Allow users to explore underlying data when needed.
Real-time Dashboards in Action
Let’s explore how different teams leverage Real-time Dashboards for measurable impact:
| Department | Real-time Use Case | Benefit |
|---|---|---|
| Sales | Track daily performance, leads, and conversions live | Respond faster to market changes |
| Operations | Monitor production output, downtime, or logistics | Detect bottlenecks early |
| Finance | Watch expense trends and revenue inflows | Ensure real-time cash flow visibility |
| Marketing | View campaign results and engagement metrics | Adjust targeting dynamically |
| Customer Support | Track ticket response times and satisfaction | Improve SLA compliance instantly |
How Lumenn AI Powers Real-time Dashboards
Lumenn AI takes Real-time Dashboards to the next level with AI-powered automation, no-code visualization, and in-place analytics. Here’s how:
- In-Place Analytics: Run live queries directly on your enterprise data—no data movement or ETL required.
- Multi-Source Connectivity: Securely connect Snowflake, Redshift, BigQuery, PostgreSQL, AWS S3, and Azure SQL in seconds.
- AI Auto Analyst: Automatically detect anomalies and surface insights without manual monitoring.
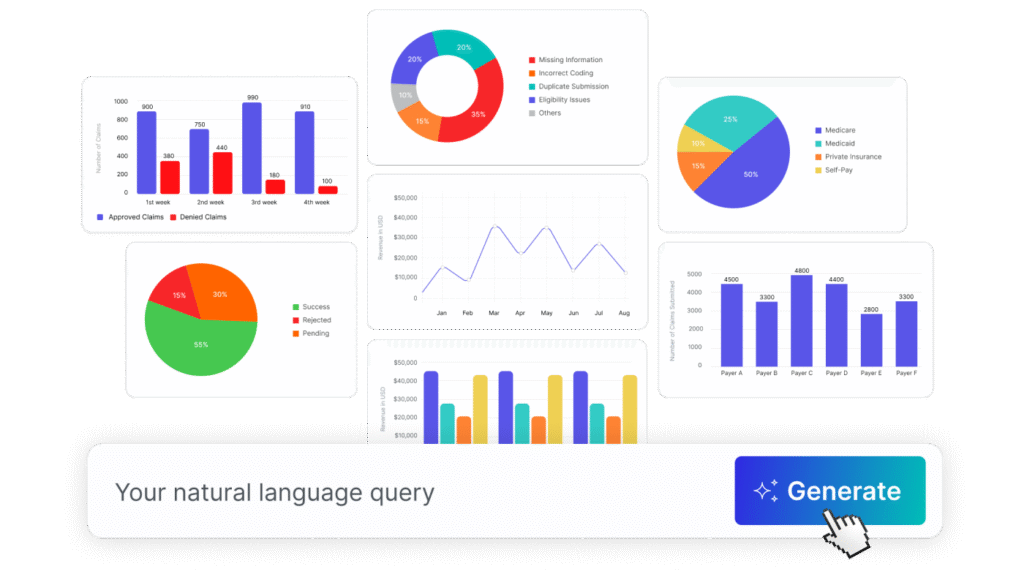
- No-Code Dashboard Builder: Create and customize dashboards using simple drag-and-drop or natural language prompts.
- Data Quality Engine: Get real-time quality scores and validation, ensuring reliable results.
- Secure & Compliant: Role-based access, encryption, and audit logs keep your analytics environment protected.
With Lumenn AI, you’re not just visualizing data—you’re acting on intelligence as it happens.
Best Practices for Real-time Dashboard Success
To get the most value from your Real-time Dashboard, follow these proven practices:
- Start with a focused set of KPIs, expand gradually as teams mature.
- Combine historical and real-time data for context.
- Auto refreshing dashboards.
- Validate data quality continuously to build user trust.
- Align dashboard updates with business workflows for seamless adoption.
- Encourage collaboration by sharing dashboards across teams securely.
The Future of Real-time Dashboards
As data velocity increases, Real-time Dashboards are becoming the cornerstone of agile business intelligence. The integration of AI, automation, and generative analytics is reshaping how organizations discover insights and act on them.
Future-ready enterprises will rely on real-time, context-aware dashboards that not only display data but interpret and recommend next steps autonomously.
Lumenn AI is pioneering this shift, enabling every business to move from reactive decision-making to proactive intelligence.
Conclusion
In a world where milliseconds matter, a Real-time Dashboard gives you the edge to respond faster, optimize performance, and lead with data. It’s not just about visualization, it’s about empowering your entire organization to act with precision and agility.
With Lumenn AI, building Real-time Dashboards is effortless—connect, visualize, and act on live insights instantly.