Table of Contents
After choosing AI-generated rules or defining your own:
- Click Save & Run.
- Lumenn AI will begin executing all configured rules and analyzing the dataset.
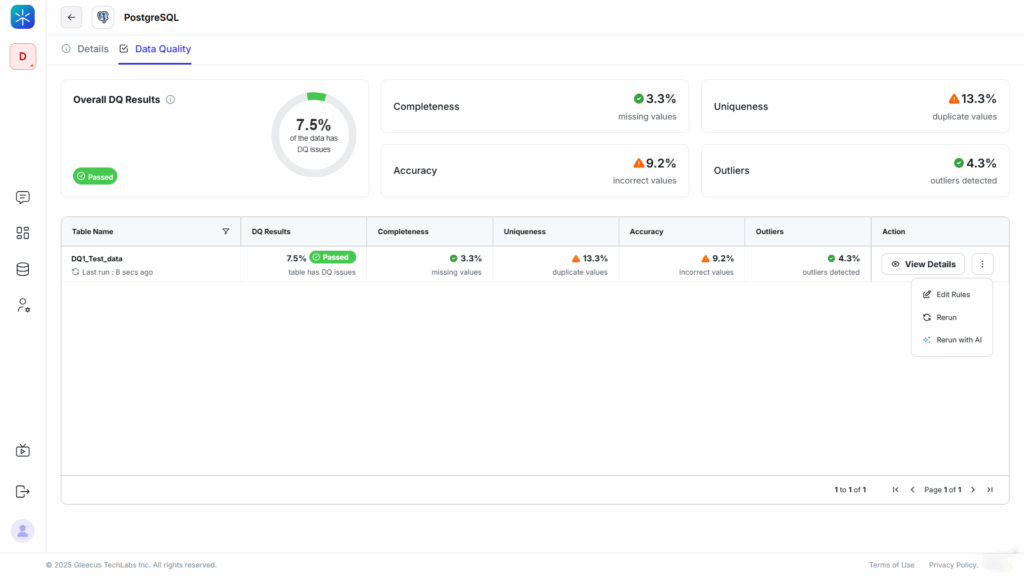
Step 1 — Understanding Data Quality Results
Once the evaluation completes, Lumenn displays high-level Data Quality metrics for each table:
- Completeness (percentage of null values)
- Uniqueness (percentage of duplicates)
- Accuracy (percentage of incorrect or invalid values)
- Outliers (detected anomalies)
You will also see an overall DQ Score and a summary of the most affected columns.
Click View Details to dive deeper into the results.
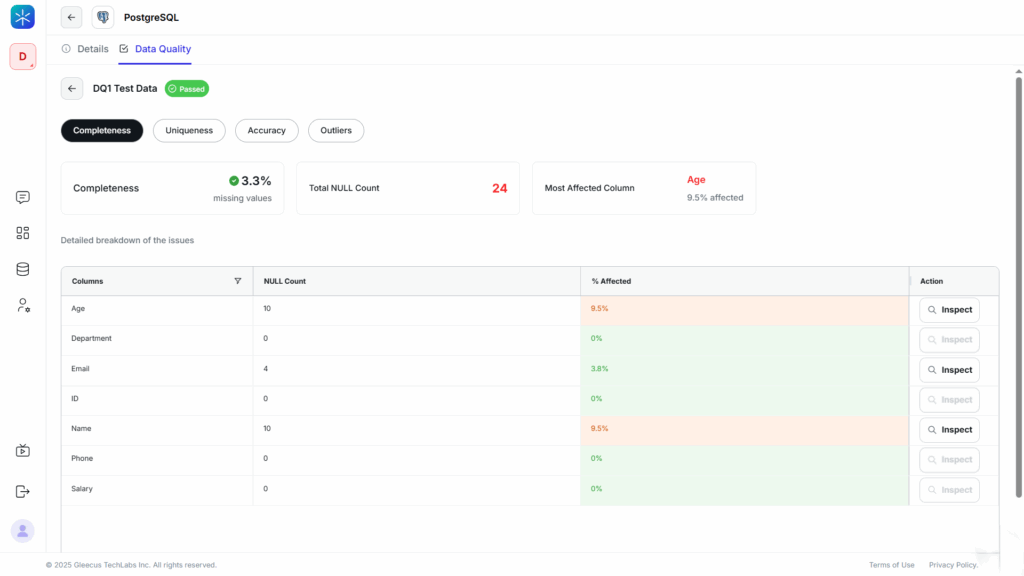
Step 2 — Drill Down into Column-Level Insights
In the detailed view, you can explore Data Quality metrics for each column:
- Completeness %
- Uniqueness %
- Accuracy %
- Outlier %
You will also see counts for:
- Null values
- Duplicate entries
- Incorrect values
- Anomalies
This helps you identify which columns require immediate attention.
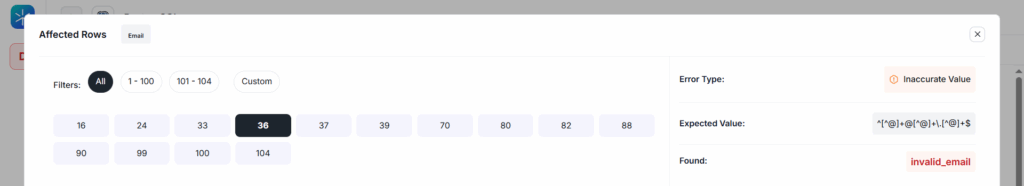
Step 3 — Inspect Row-Level and Cell-Level Issues
For precise debugging:
- In the Column Details section, click Inspect next to any column.
- Lumenn displays:
- The exact rows where issues were detected
- The incorrect or unexpected values
- The rule or expected pattern the value should match
This is the deepest level of Data Quality investigation, allowing you to pinpoint and resolve issues at the cell level.