Table of Contents
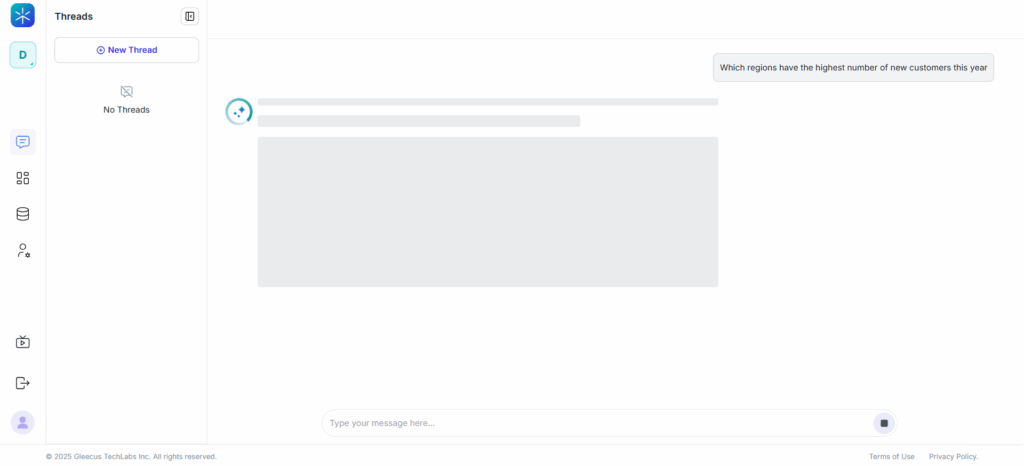
Enter Your Query
- Click New Thread.
- In the chat input box, type your question in simple, natural language.
Examples:- “Show monthly revenue by region for the last 12 months.”
- “Top 10 products by units sold in Q3.”
- Click Generate.
What happens next:
Lumenn AI analyzes your question and provides:
- A text-based summary of the insight
- A set of recommended visualizations that best fit your query and available data
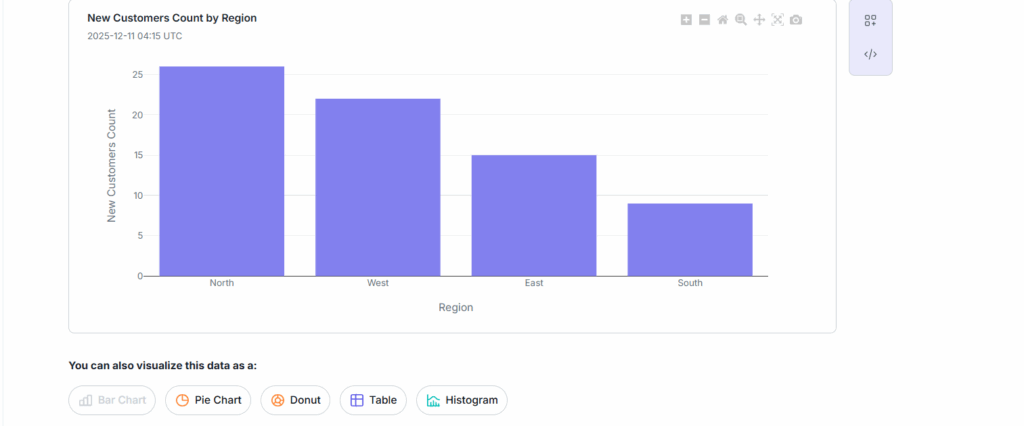
Select a Suggested Visualization
- Lumenn displays several AI-recommended visualization options (bar chart, table, pie chart, etc.).
- Click the visualization type you want to generate.
- Lumenn instantly renders the chart based on your selection.
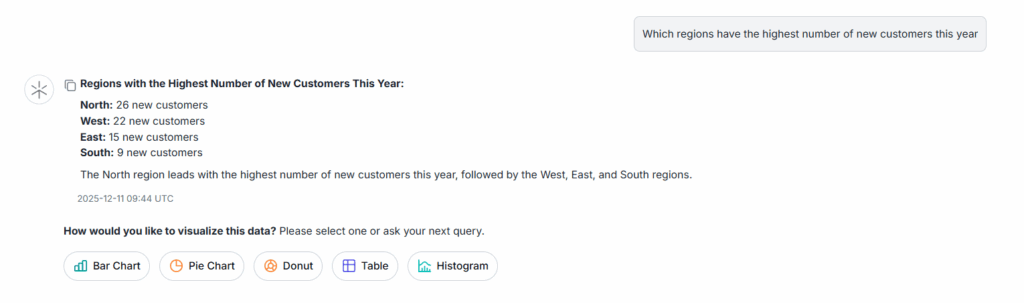
Explore Alternative Visualizations
- After your first chart is created, Lumenn shows additional visualization types you haven’t used yet.
- Click any alternative option to generate more views of the same insight.
- Continue selecting different visual types until all available options have been explored.